
As with many of my blogs the idea for this one came after listening to a late night Radio 4 programme. The programme was one of my regulars, Costing the Earth, an environmental programme, which was entitled The Ozone Hole, Thirty Year On. The more I thought about this article the more I thought that this was pertinent to my industry and later that night I then remembered a meeting from a couple of days back. The meeting had been with a company providing feedback systems for care homes and I saw similarities which I then realised can be extrapolated to many many businesses.
So, on with the History lesson. In 1982 Researcher Joe Farman and his team had been collecting atmospheric data at Halley Bay, Antarctica using a Dobson Meter. These machines use one fixed point directly above the machine and after a seasons usage Farman and his team found an alarming decrease (40%) in the levels of Ozone within the atmosphere.
 Farman was an experienced researcher, conducting surveys in the region since the 50’s, and he knew that these machines were notoriously difficult to keep working in the extreme conditions. He thus decided that for the following year he would order a new Dobson Meter.
Much to his surprise however, Farman found that the readings obtained were still indicating that the ozone levels were depleted the following year. He thus decided that it must be a fault of the fixed point they were taking the measurement from. The following year Farman and his team decided to take readings from two sites to try and negate this, The readings were taken from Halley Bay as before and a location 1000 miles Northwest. Sadly the data only backed up the readings they had obtained in years past. The mounting evidence was by this point undeniable, and worse still, looking further into the data which was a simple piece of graph paper like this:-

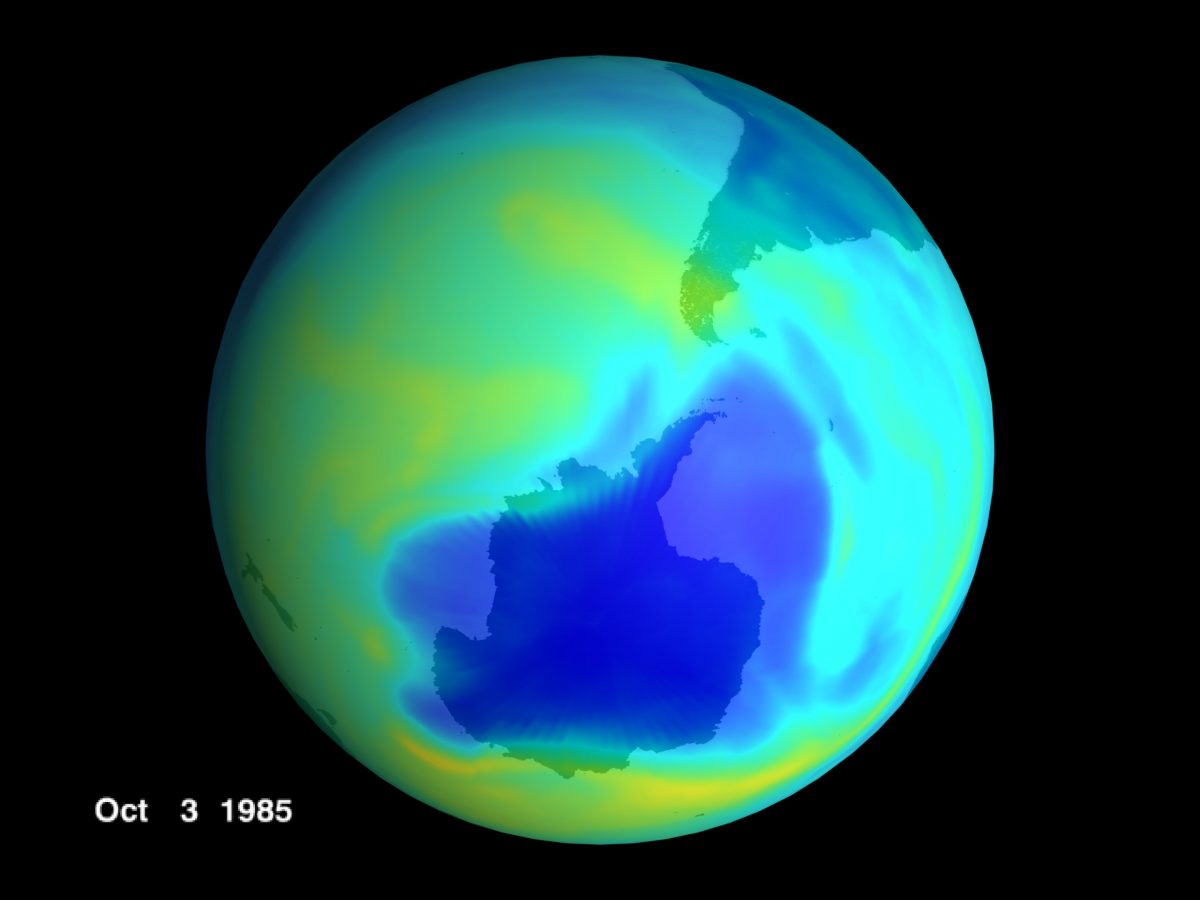
Farman and his team could see that the actual depletion had been occurring since 1977! In 1985 Farman published his data to a world that had been caught sleeping. This publication shocked the scientific world to its very core and changed the way we think about our world forever. If they had not have published at that time, we might all be drowning now, and not just in data.
The thing is, its not like they were the only people who were interested in this area of ozone. There was the small matter of NASA (You’ve heard of them, right?) who with their massive resources were blissfully unaware of the levels of depletion. This was massively embarrassing for them as they had an array of satellites that were, amongst other things, supposedly monitoring this (Note not all of these satellites were in operation at that time and there are others that were).

In addition they had a huge amount of computing power to throw at this, I suspect this was NOT their server room in 1985 but you get the picture!

So how did 3 men with thick jumpers, warm hats, Wall street crash era technology and a single piece of graph paper discover a hole that, ironically, turned out to be the size of America where the entire resources of the American Space programme could not. The answer lies in a term that we really have only just started to hear within the last 5 years.
“Big Data”.
In fact, it was probably the original “Big Data”. The crux of the issue with NASA was that they obtained readings on a continual basis, constant monitoring of the climate leads to gargantuan amounts of data. The thing with dealing with huge amounts of data is that it never gets near to a human as we just cannot process that much data, its just physically impossible. Instead we write software that is used to sum up this data for us, present it to us in a way that our monkey brains can process. The other issue of course with data is that there are often anomalies within it, sometimes a satellite or some other object may pass in between the earth and the monitoring satellite. Now this is no problem if a human is conducting the test, they would possibly notice or maybe even repeat the test ignoring the data realising that something is wrong; Computers though, can do one of two things:- report the data as is, which in most instances would massively skew the data or ignore the data entirely as it falls outside of recognised boundaries. The latter is exactly what happened with NASA, they ignored the aberrant data presumably for a very long time!
And this is the point about data, its all well and good capturing data but unless you do something with it, whats the point!. There are millions and millions of systems capturing all sorts of data all of which could if properly used enhance the world at large. There is of course a cost to analysing this data but if you don’t take that investment step you cannot expect to reap the rewards, bountiful as they are. Some companies are good, really good at using their data. Facebook for instance is incredibly good at it, and more to the point they have turned it into a revenue stream. We willingly submit so much personal information on the understanding that we only share it with our friends and to a degree this is true, advertisers however do have access to this data (anonymised) so that they can better target their Facebook advertising campaigns. Most companies though are not so good at utilising their data, properly used this deluge of data could:-
- Save billions of pounds to many many companies
- Save lives, minute by minute, second by second.
- Seriously constrain criminal activity.
- Enrich and improve lives.
Not all of these will save the world (which I think it is pretty much undeniable that Farman and his team did back in the years of big hair, big shoulder pads and mobile phones you could paddle down the Thames to work on) but acting on this data could make immeasurable changes to our world at large. If you are drowning in your big data, stop and act, before we all drown.