
Its a bit left field I know, but I’m just gonna come out with it and embrace the crazy….I often wander what Florence Nightingale would have made of Business Intelligence….There, I said it. Wait a minute I hear you say, what tangential leap of idiocy led you to use all of those words in just one sentence? Well, it is true that there may be some maternal familial link with the lady of the lamp; how strong or real that link is I have no clue but it’s not this that caused my apparent crazy talk, it’s not this at all. Its also not alcohol though lord knows I’d love a drink right now, Its been a long week with a looming deadline and every weekend in this month has got ‘sleep deprivations’ stamped all over it. No, it was actually a chance biography of the great lady herself on Radio 4 this week as I was bound for Cornwall late one night that made me see her in a different light entirely (no pun intended!). Ironically Florence’s maternal grandfather who was a staunch ally of William Wilberforce was once the MP for Camelford, Cornwall. Now…. we all think that we know of Florence Nightingale, the lady of the lamp; except as this biography went onto detail this impression of her is projected from such a short period in her life. 2 years in fact. This is like me being remembered as a baker. We imagine that she was this fantastic nurse with an amazing bedside manner who soothed and cured a great many soldiers who were heavily wounded in the Crimean war. To a degree there may be some truth in this although her sister claims she was a darn lousy nurse! We should of course always take sibling rivalries with a pinch of salt. I guess the endurance of this image of the lady with the lamp is in part down to the amazing impact that she had on a great many people who were injured, possibly dying, in a foreign country, the vision would have burnt strongly into the memories of those who survived and witnessed those days and the image would have been passed easily into society at large. Even today, 150 years later Florence represents nursing at its purest.
But nursing was a very small facet of the Nightingale girl, she was an acutely intelligent, determined, beautiful, singleminded woman who from a very early age was driven to follow her hearts desire in all matters except love! She was also by all accounts fearsome. Growing up at a time when girls were not educated she was fortunate to have a father who rigorously educated his daughters, Florence was no slouch and would famously wake at 3am to study Greek, Mathematics and Philosophy. Terrified at the prospect of the ‘Drawing Room’ life that women of a certain class at that time were expected to follow Florence announced at the age of 16 that God had come to her and called her to service; her sister later noted however that Florence had the same resolute and iron will as any god.
I know what you’re thinking right about now, where does the Business Intelligence come into this. Well, from a very early age the ‘Star’ of our feature would record data in tables, how many 9 year olds categorise their collections and their fruit and vegetables in tabular format. I feel sure that had Florence have ever caught sight of Microsoft Excel she would have been in her element creating tables for every single thing that you could possibly record. This habit and eye for meticulous detail was where her real impact on the nursing world would come. On her arrival at Scutari she was frustrated at the lack of record keeping surrounding the patients and she immediately set about putting this to rights. Her tables were incredibly detailed but what was truly amazing was that she realised that not everybody could look at a table and read the value contained within. She thus decided some of this data should be displayed as graphs to allow more people to understand what she already knew from the data. Moreover when faced with the prospect of communicating the make up of fatalities over a 12 month period from Scutari (broken down by three broad causes of death) Nightingale invented a new graph, The Polar Area Graph. The graph that she created was this one:-
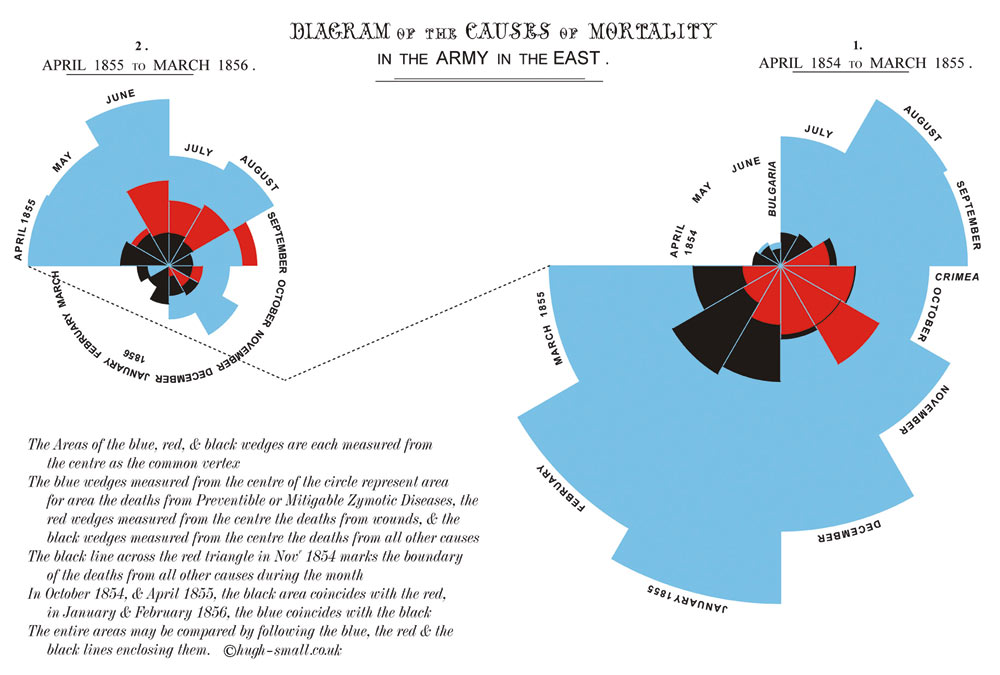
The graphs simply radiate from the centre and show :-
- Red:- No of deaths from injuries received
- Blue:- No of deaths from preventible diseases (not related to injuries receieved)
- Black:- No of deaths from other causes.
The big picture here is that over the course of two years at Scutari through improvements in working conditions, hygiene, ventilation and most importantly improvements to the sewerage system the number of deaths from preventible diseases (which was at the outset 10 times that of wound fatalities) fell off sharply. The sewers were not addressed until January/February 1855 and as such you can see the improvements month by month from this date.
And what of this… I mean, its just history right? Well no not really, what this is is a lesson in realising that there may be valuable data within your business that you are not aware of. It can sometimes take a lady with a lamp to shine a light into all the dark corners of your enterprise in order to flush this data out. Once the data is exposed you can then start to learn from it, you may well be the kind of person for whom tables sing and dance but you should also try to remember that we don’t all think the same. Sometimes we need to represent our data in ways that are more consumable by people who don’t think that the world begins and ends with Excel.
As for Florence, I’m gonna go out on a limb and say she’d have loved where BI Is today, I think she’d probably be a bit of a geek, inventing new charts at the drop of a hat and loving the information that all that data gives you. If only we could drag her away from those darn spreadsheets!